 Two variable equations worksheets Grade 6

- INTRODUCTION
- Download worksheets
- Related Contents
- How to identify relationships in two variable equations work...
Get more contents on Two variables equation Grade 6...
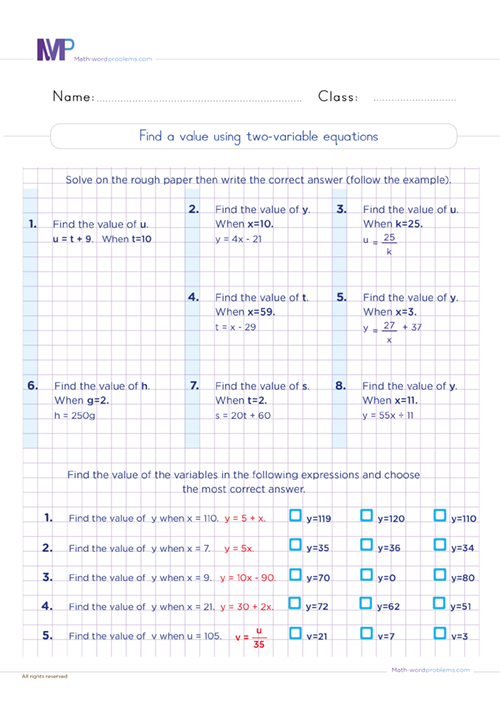
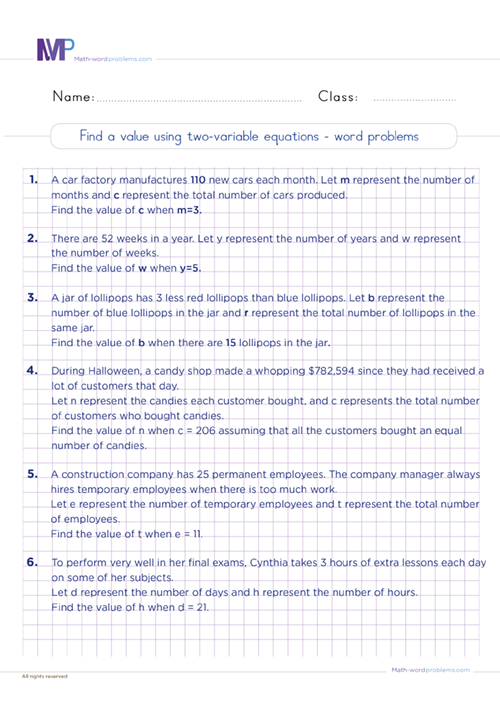
Encourage your kids to learn how to solve a variety of two-variable equations worksheets Grade 6 using straightforward techniques and strategies. As 6th graders are already familiar with solving one-step equations, they will readily realize that two variable equations exercises require solving just an extra step, i.e., two steps to find the value of the unknown. In this case, one variable is known, and the other is unknown. Linear equations have a constant rate of change, or slope, and can be used to model many real-life situations, such as rates of change, trends, relationships, etc.
With this in mind, our two-variable equations worksheets will provide short and simple practice exercises and learn how to create and solve equations from number sentences. We have already heard that two variable equations consist of two unknown quantities, usually represented by x and y. For example, 4x + 5y = 12 is a two-variable equation. The essential thing required of us is to find the values of x and y that make the equation true.
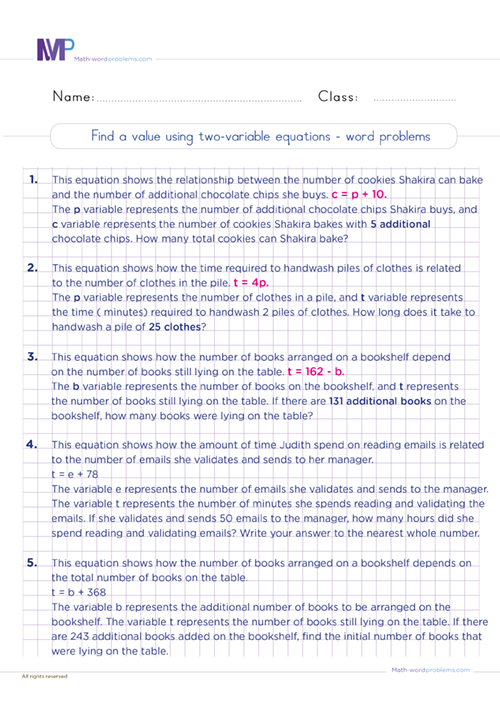
However, we will also learn to represent linear equations for word problems. To captivate kids' attention in solving this concept tirelessly, we will formulate interesting and familiar real-world situations such as distance-time relationships, cost-profit scenarios, or mixtures problems. The following steps will guide kids when representing linear equations for word problems.
-
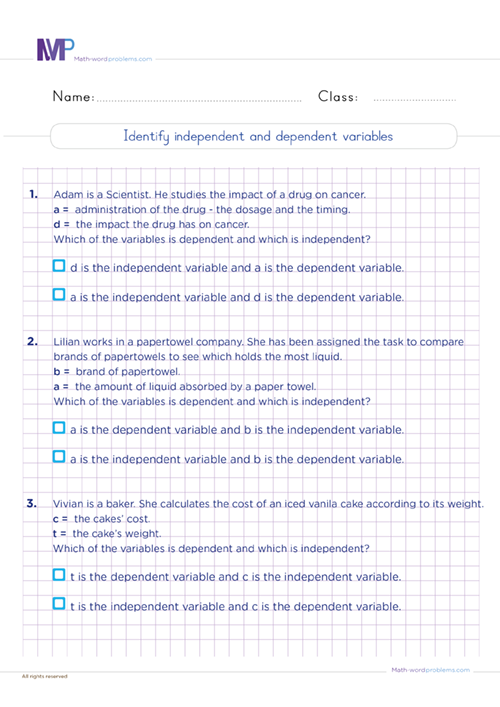
Choose letters to represent the unknown quantities and write what they stand for.
-
Translate the words into mathematical symbols and write an equation that relates the variables.
-
Use one of the methods described above to find the values of the variables.
-
To check your answer, plug your solution into the equation and see if it makes sense in the problem context.
In math, the three main ways to represent a relationship are using a table, a graph, or an equation. Thus in these two variable equations worksheets, you'll see how the same relationship can be represented on a table, graph, and equation.
Graphing linear equations in two variables Worksheets with answers grade 6
Your kids will have fun as they practice graphing linear equations in two variables Worksheets with answers grade 6. Our two variable equations worksheets Grade 6 are well structured, with exceptional and quick-to-understand designs that will enable kids to recognize the relationship between the solutions of an equation and its graph and learn how to graph a linear equation in two variables by plotting points.
Also, graphing linear equations creates a visual that helps to explain the relationship between two variables. Hence, we can easily see what happens to one variable as the other increases. As we move to the right on a graph, the value of the x variable increases. If the line moves up, the y variable also increases, but if the line moves down, the y variable decreases. But if the line remains the same, the y variable has not changed. This fun activity will instill excitement in kids while learning.
Apart from simply graphing and identifying relationships from graphs, we must note that graphing linear equations with two variables is a vital skill in geometry and algebra. In fact, it helps model all kinds of relationships in math and the real world.

How to identify relationships in two variable equations worksheets Grade 6
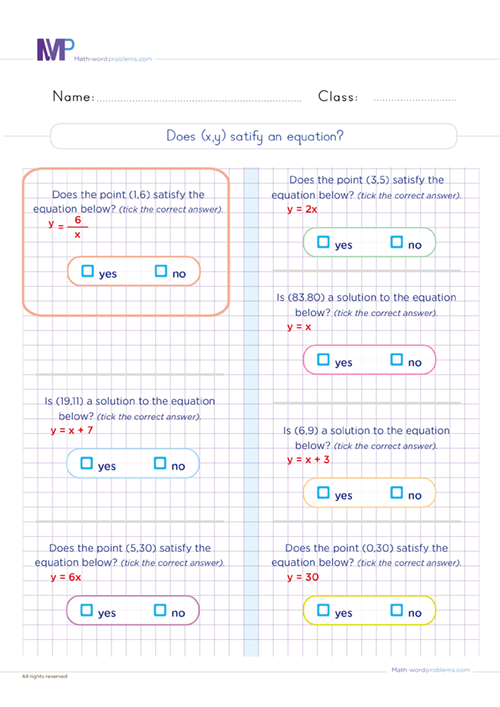
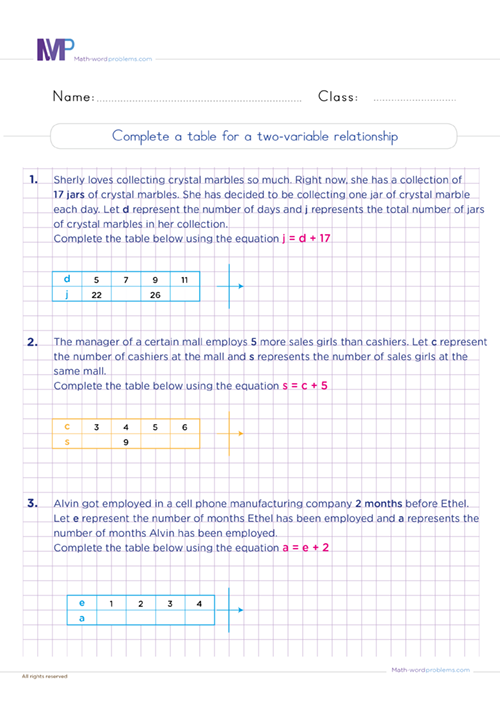
Engage in this remarkable resource and learn how to identify relationships in two variable equations worksheets Grade 6. Here, you'll see how a line equation describes the relationship between x and y values on a coordinate plane. To make this exercise interesting for kids, we will design simple tables with the x and y values corresponding to the coordinates of points on the graph.
This table of values will map out the corresponding x and y values for the given line. In most cases here, we'll design a graph and table with some missing values of x or y so that kids can complete the table from the relationship on the graph. In such situations;
-
take any x value on the x-axis and Substitute that into the linear equation to see what you'll get when you solve for y on the y-axis. By so doing, you get a range of input values.
-
Choose another x value you want to work with and solve for y again. Repeat as many times as you wish to work out sets of values to put into your table.
Once your table is complete, check if the sets of values on your table correspond to the points on the graph. If yes, then you've become an expert.
