 Coordinate plane worksheets Grade 6

- INTRODUCTION
- Download worksheets
- Related Contents
- Important points to note about coordinate plane worksheets G...
Get more contents on Coordinate plane Grade 6...
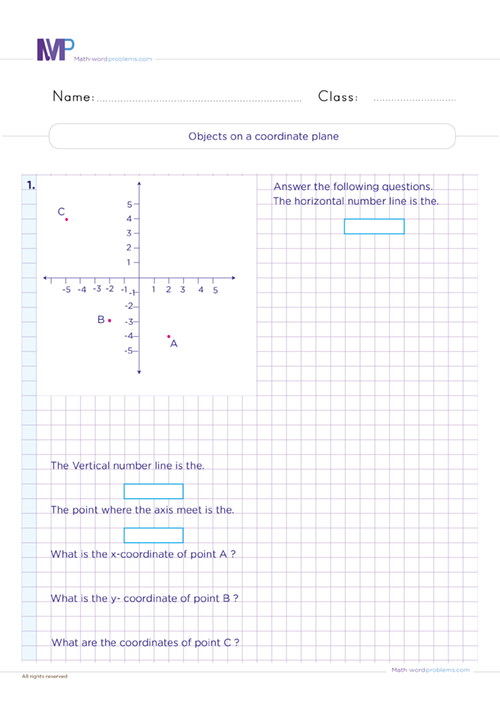
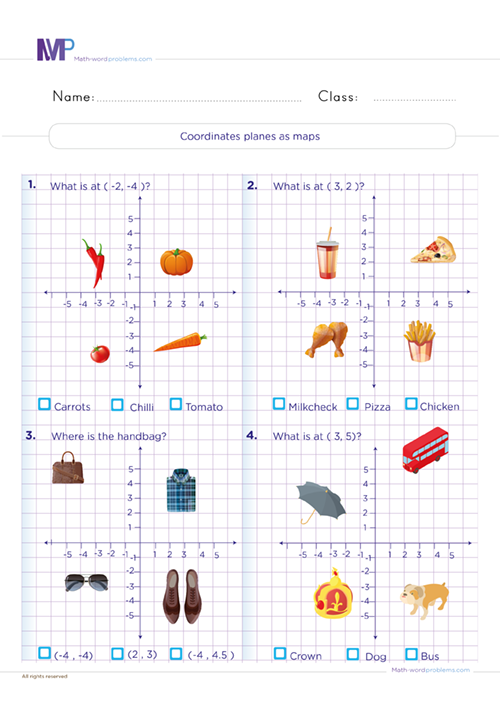
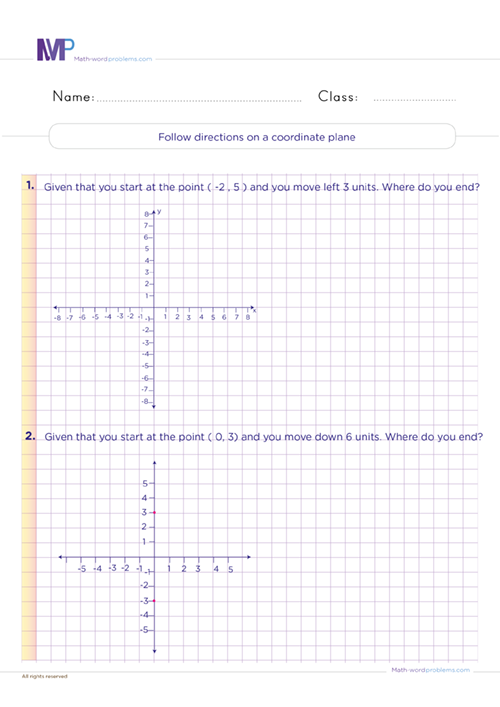
Your kids will learn more about geometry shapes and graphs as they engage in our coordinate plane worksheets Grade 6. These worksheets consist of fun exercises wherein kids will draw, plot and interpret points on a coordinate plane. These coordinate planes serve as maps, helping to give directions from one point to another.
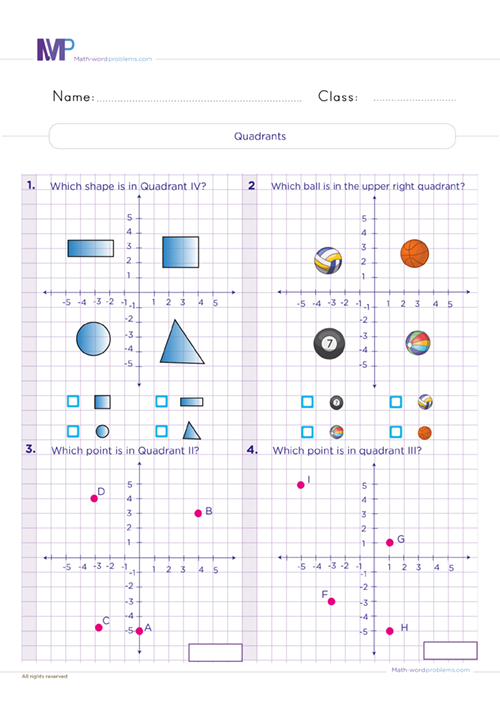
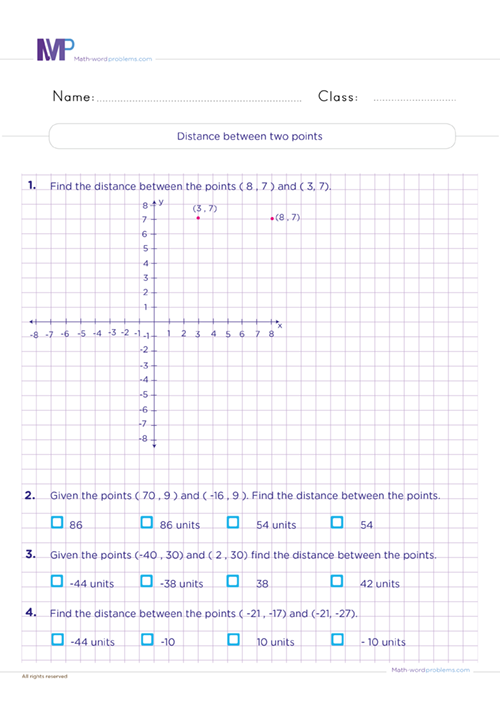
Also, this resource covers all concepts related to coordinate planes, such as plotting points, ordered pairs, representing and interpreting data, understanding quadrants, the distance between two points, graphing inequalities, and ratio relationships.
To captivate kids' interest and desire to solve these coordinate plane worksheets at all times; we have used fun and beautiful objects to describe coordinate planes as maps and to understand quadrants.
Plotting points on a coordinate plane worksheet free 6th Grade
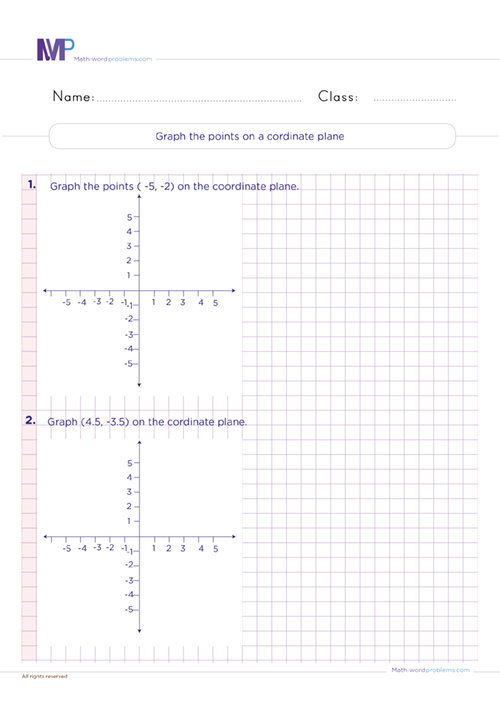
Among the many exercises in this coordinate plane resource are plotting points on a coordinate plane worksheet free 6th Grade. In this worksheet, your 6th graders will practice plotting points with two coordinates on a regular coordinate grid with the x and y-axis.
Once your kids grasp these coordinate plane skills; they will become experts in reading and analyzing graphs, mapping an area, describing space using a combination of x and y directions, etc.
Besides, learning how to plot points is a gradual way of presenting statistics and describing algebraic relationships in a visual sense
How can you plot points in a coordinate plane following ordered pairs?
Important points to note about coordinate plane worksheets Grade 6 and plotting points
Below are important points to note about coordinate plane worksheets Grade 6 and plotting points. First, you must understand that a coordinate plane consists of two crosswise lines, the x-axis and the y-axis. The x value tells you how many units to move horizontally, while the y value tells you how many units to move vertically. The intersection of these lines creates the origin, which is the point (0, 0).
Secondly, just like a number line, the values in the x-axis increase and are positive as we move to the right from zero. As we move to the left from zero, the values decrease and are negative.
Next, with the y-axis, the values are positive and increase as we go up from zero. As we move down from zero, the values are negative and decreasing.

