 Data and graphs worksheets Grade 6

- INTRODUCTION
- Download worksheets
- Related Contents
- How to use different types of graphs in data and graphs work...
Get more contents on Data and graphs Grade 6...
Engage your kids in these remarkable data and graphs worksheets Grade 6, where they'll practice communicating the relationship between two sets of data in a realistic, concise, and easy-to-understand way. We often face difficulties presenting information to readers, considering how extensive and confusing such information is. Thus, graphs always play a vital role here as they'll help simplify such information and highlight only the most essential facts.
We will design graphs of all types, illustrating how to create, plot, and interpret them. Some of these graphs include; line graphs, bar graphs, histograms, pictographs, frequency tables, line plots, and stem and leaf plots.
Once you have mastery of these graph types, you can select the best one to use depending on how you want to present your data. For instance, when we want to present exact numbers, it is best to use tables. On the other hand, we use graphs most often when making comparisons. Nevertheless, to make our work clear enough and most stimulating to kids, we will design each graph in its worksheet so that kids will stick to practicing one type of graph (worksheet) before moving on to another. Moreover, our data will focus mainly on fun real-life experiences, thus captivating kids' interest.
Interpreting graphs worksheet pdf 6th Grade
Interpreting graphs worksheet pdf 6th Grade is an outstanding tool that offers kids essential tips when reading any graph. One interesting thing you must note in these data and graphs worksheets Grade 6 is our idea of designing different types of graphs in different worksheets for kids to practice and learn.
The first tip to quick interpreting graphs is mastery of the different graph types. With this mastery, you'll understand that each graph serves a particular purpose.
Secondly, always pay attention to the graph's title, units, and labels. They will tell you exactly what the graph is all about. Also, you'll get to see what information is described on the x-axis and y-axis.
Thirdly, take note of how values are changing, increase and decrease. Equally, ask yourself if there's a relationship between the variables.
Above all, our main objective in this resource is for 6th graders to obtain the best data and graphing skills. These skills are foundational for advanced math skills such as algebra, trigonometry, coordinate geometry, organizing information, comparing group concepts, general problem-solving skills, etc.


How to use different types of graphs in data and graphs worksheets Grade 6
Your kids will learn how to use different types of graphs in data and graphs worksheets Grade 6. As we said earlier, knowledge of different graphs will help you select the best one to use depending on how you want to present your data.
-
Line and double-line graphs are perfect for displaying information and making predictions based on data history that changes over time. They are also good when comparing two or more situations over a given period.
-
Bar graphs compare two more values using rectangular bars.
-
Histograms show continuous data in rectangular columns.
-
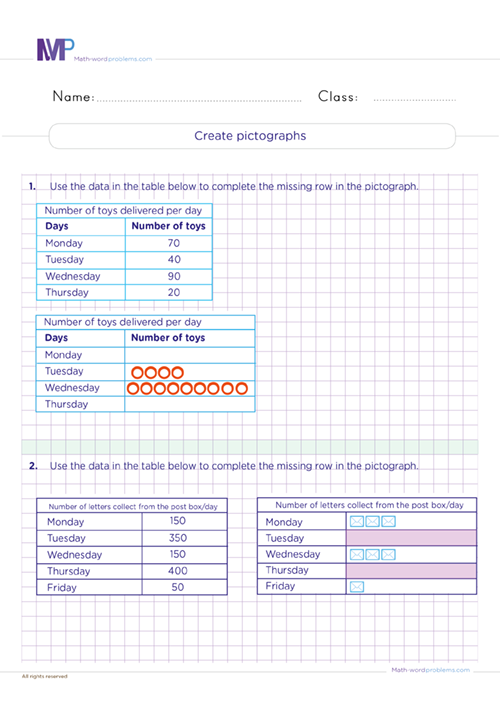
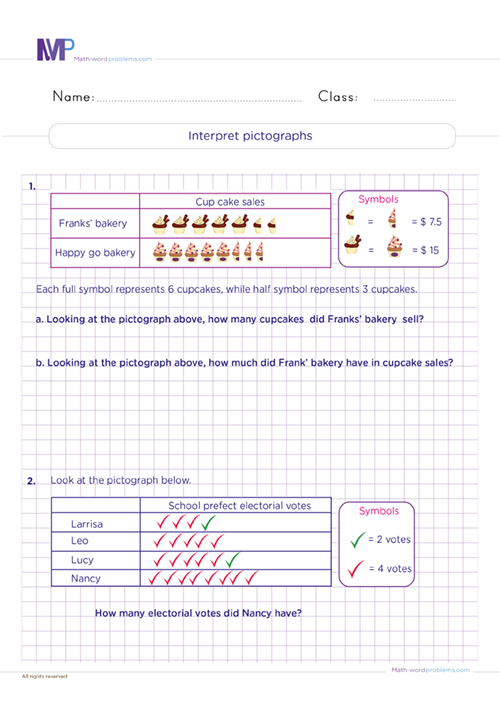
Pictographs display numerical information using pictures or icons to compare two or more values.
-
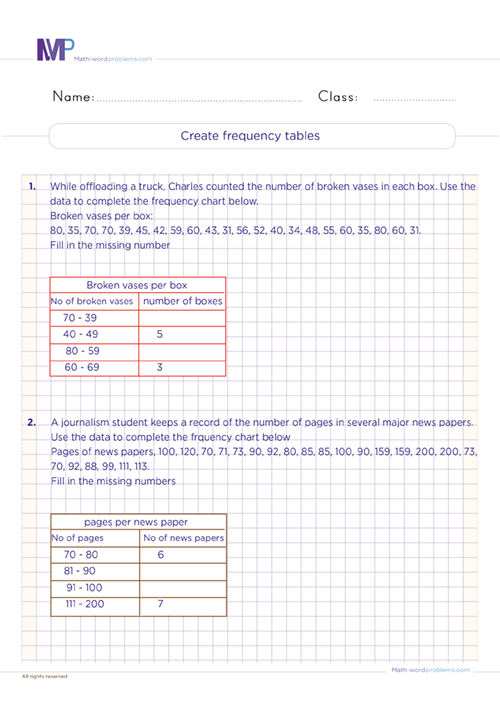
Frequency tables present the number of times an item occurs in a data set.
-
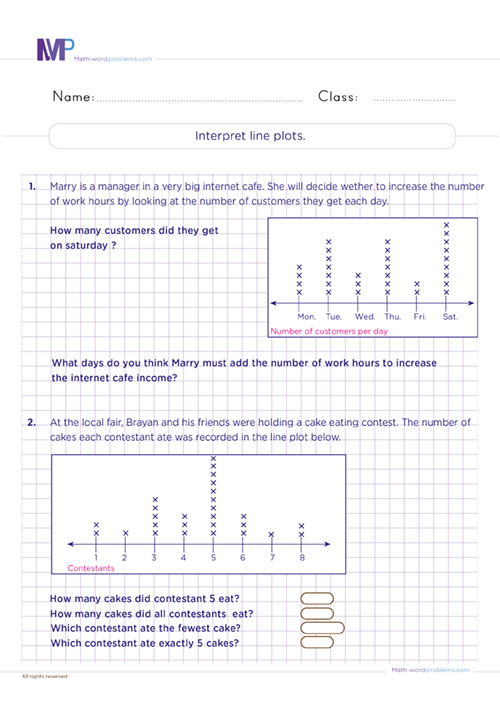
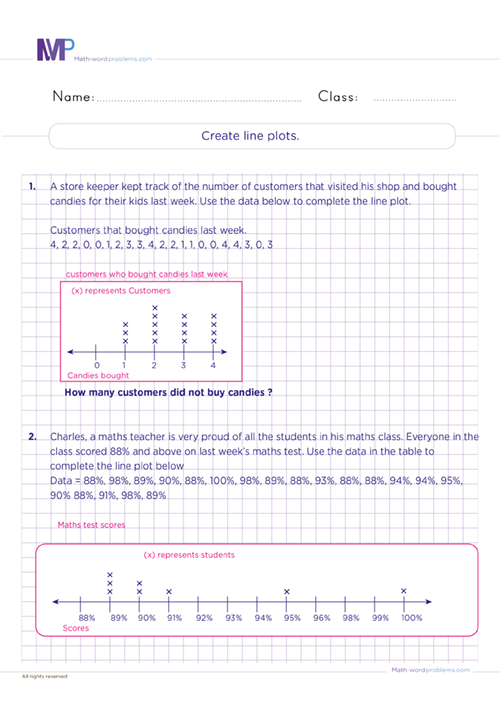
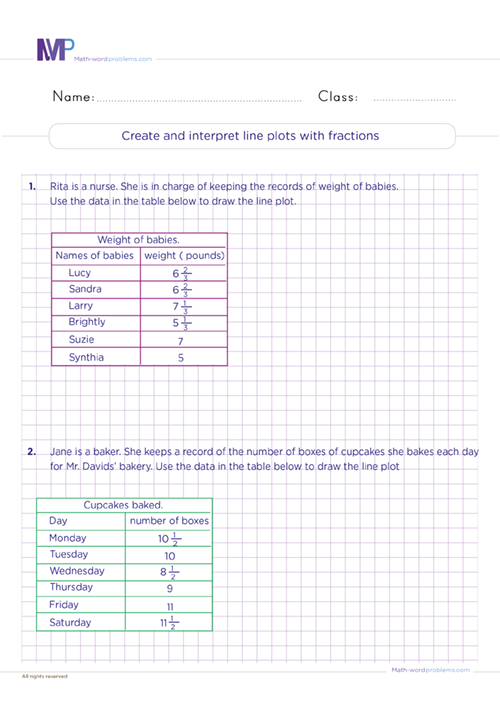
Line plots show the data set's shape by stacking X's above each data value on the number line.
-
We use Stem and leaf plots to display quantitative data or the actual numerical values of data points arranged by place value.