 Statistics worksheets Grade 6

- INTRODUCTION
- Download worksheets
- Related Contents
- Importance and uses of statistics in math and real life
Get more contents on Statistics grade 6...
Statistics worksheets Grade 6 offers straightforward tips on constructing and interpreting a data set conveniently. This data set could be numbers, letters, or categories. Our focus in this resource will be to help 6th graders learn how to construct and interpret data in graphs, i.e., visual representations of data that help us to see patterns, trends, and relationships.
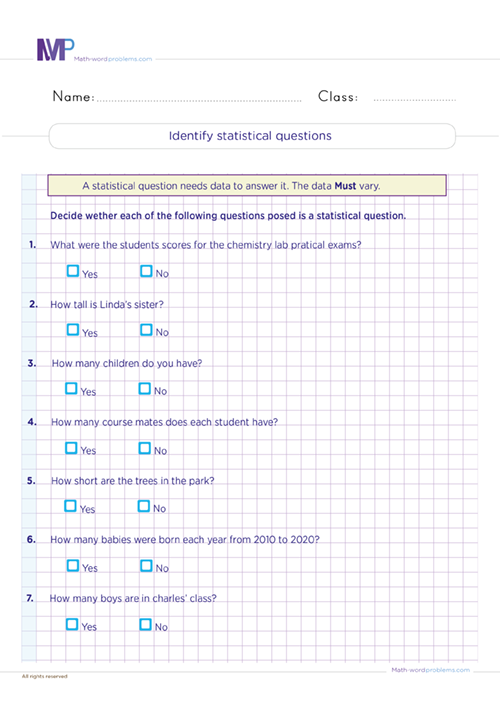
Most kids find statistical questions very challenging. That is not the case here. On the contrary, we will provide captivating statistics and data-handling exercises to strengthen and enhance kids’ reasoning skills. One such introductory worksheet is “identifying statistical questions.” This exercise will uplift your 6th grader’s critical and analytical thinking skills and help them to become familiar with statistics.
In addition to collecting, organizing, analyzing, and presenting data, kids will learn another important skill in our statistics worksheets: calculating and using measures of central tendency. These measures of central tendency are numbers that summarize a data set by showing where the data is centered or clustered. The most common measures of central tendency are mean, mode, and median.
Mean, mode, and median worksheets with answers 6th grade
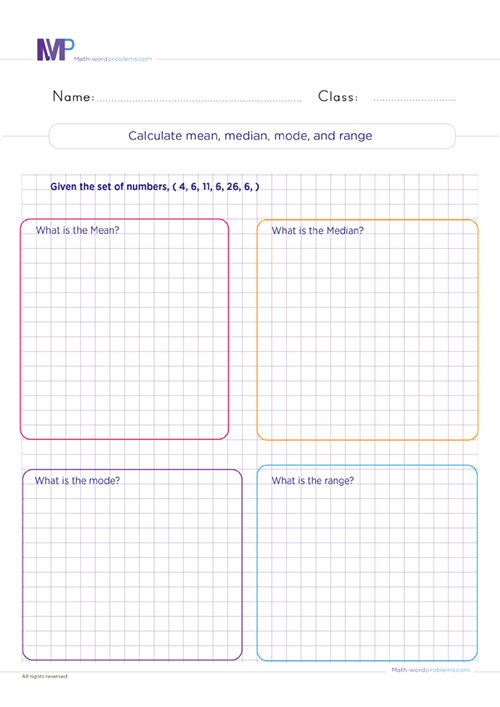
Can you identify the central position within a set of data? Get started with practicing with our mean, mode, and median worksheets with answers 6th grade, and be able to determine the numerical point in a set of data. Also, you will learn how these measures of central tendency are interlinked. Now, let’s find out how to calculate the mean, mode, and median below.
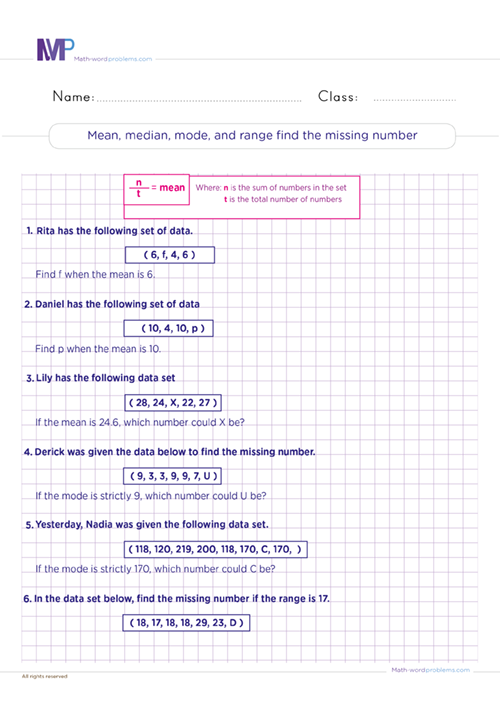
Mean is the average of a set of data. To find the mean, we add all the data values and divide them by the number of data values. For example, if the ages of four kids are 3, 4, 6, and 7, the mean age is (3 + 4 + 6 + 7) / 4 = 5 years.
Mode is the most frequent value in a set of data. To find the mode, we count how many times each data value occurs and choose the one that occurs the most. For example, if the ages of six students are 7, 9, 5, 7, 8, and 7, the mode age is 7 because it occurs three times.
Median is the middle value in a data set when arranged in order from least to greatest or from greatest to least. To find the median, we first sort the data values and then locate the middle one. If there is an odd number of data values, the median will be that in the middle. If there is an even number of data values, the median will be the average of the two middle ones. For example, if the test scores of 9 kids in 6th Grade are 76, 83, 85%, 90%, 92%, 94%, 95%, 96%, and 98%, the median score is 92% because it is in the middle.
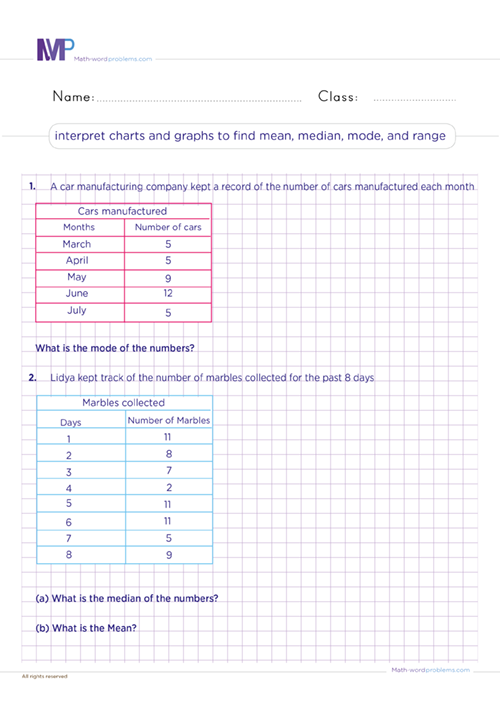
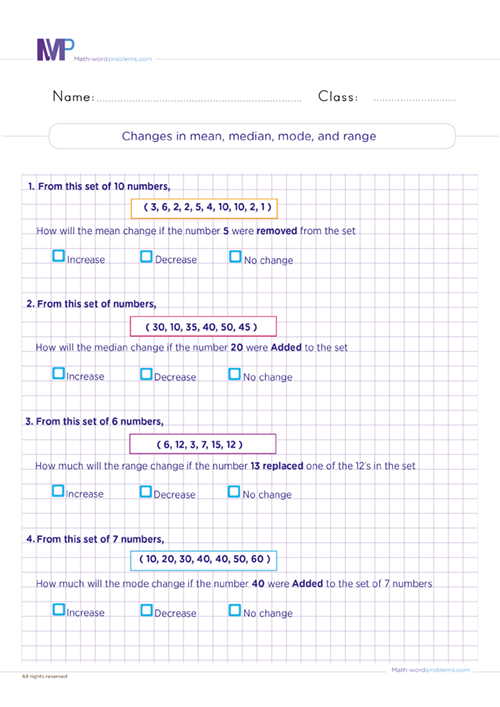
As you’ll realize from the three measures of tendencies above, each one calculates the central point using a different method. So, choosing the best measure of central tendency depends on the type of data you have. However, our statistics worksheets Grade 6 will offer kids a unique way to illustrate the central point of several datasets by interpreting charts and graphs to find mean, median, mode, and range.


Importance and uses of statistics in math and real life
There are many importance and uses of statistics in math and real life. From the example of measures of central tendencies above, you’ll bear with me that statistics help us to make predictions and decisions based on data. For example, if we want to know how well a class performed on a test, we can look at the mean score to get an overall impression. If we want to know the most common score among the students, we can look at the mode score. Also, we can look at the median score if we want to know what score divided the class into two equal groups (half scored above and half scored below).
Secondly, statistics provide the most straightforward way of distributing work among employees in a company. Also, it helps to analyze how much you spend purchasing items every week. Most importantly, statistics help you to decide the best method to use when collecting data for accurate results, etc.
Our objective in this resource is to help 6th graders practice and master statistic skills by constantly practicing with our statistics worksheets Grade 6. They include problems requiring you to calculate and compare measures of central tendency for different sets of data, construct and interpret data in graphs such as bar and line graphs. Above all, this resource comes with a detailed solution and answer sheet wherein you can check